
Keyword
maritime transport
26 record(s)
Type of resources
Available actions
Topics
Keywords
Contact for the resource
Provided by
Formats
Representation types
Update frequencies
Status
Scale
panaceaKeywords
GEMET keywords
-
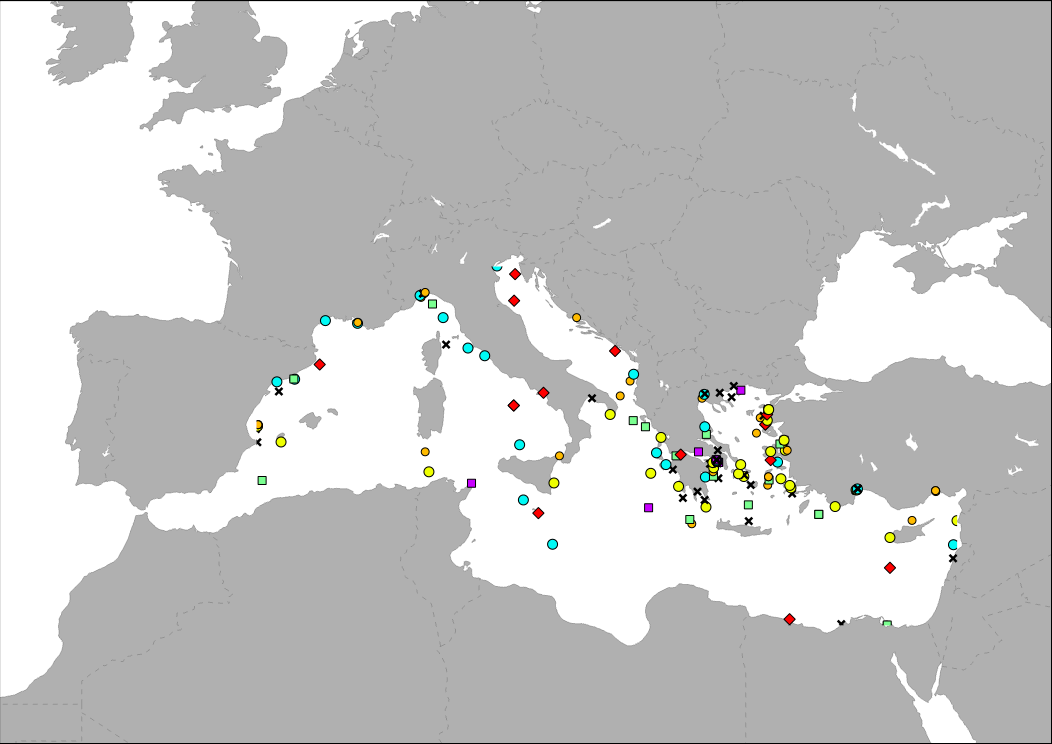
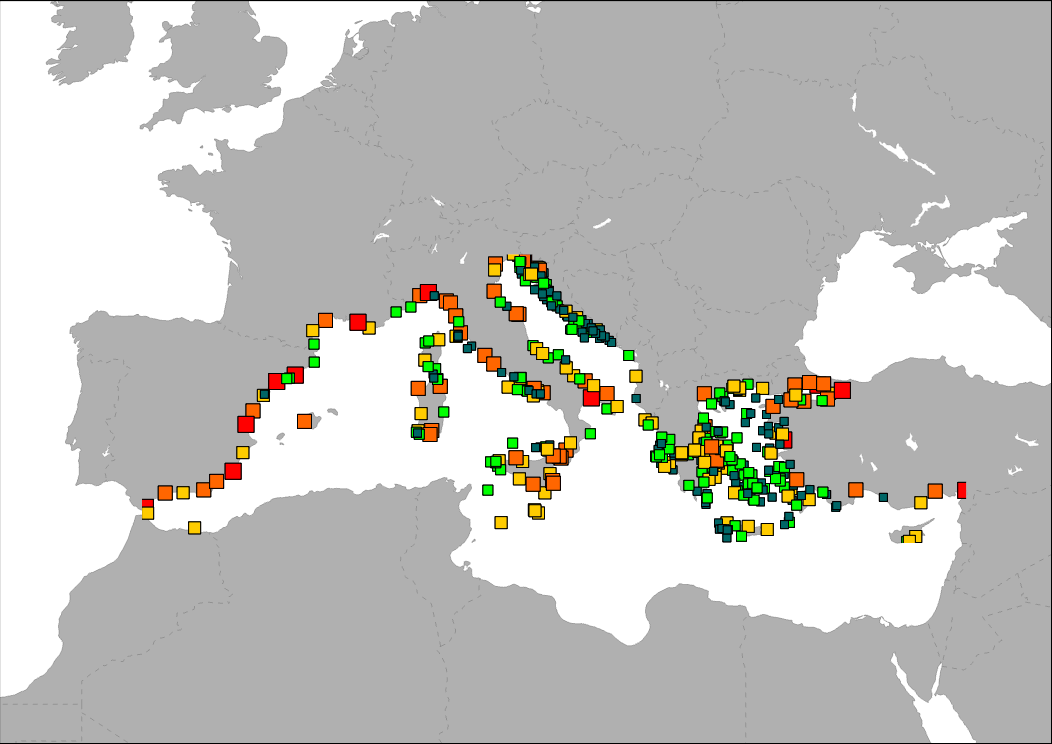
The map shows the distribution of ship alerts and accidents along the Mediterranean Sea, between 2008 - 2014. This point layer represent the location of ship accidents registered in the database of the Mandate of the Regional Marine Pollution Emergency Response Centre for the Mediterranean Sea (REMPEC). Database includes accidents that caused pollution by oil or other hazardous and noxious substances (HNS), or were likely to cause it.
-

The map shows the distribution of main passengers transport ports in the Mediterranean Sea. Ports are classified in groups according to its level of activity.
-
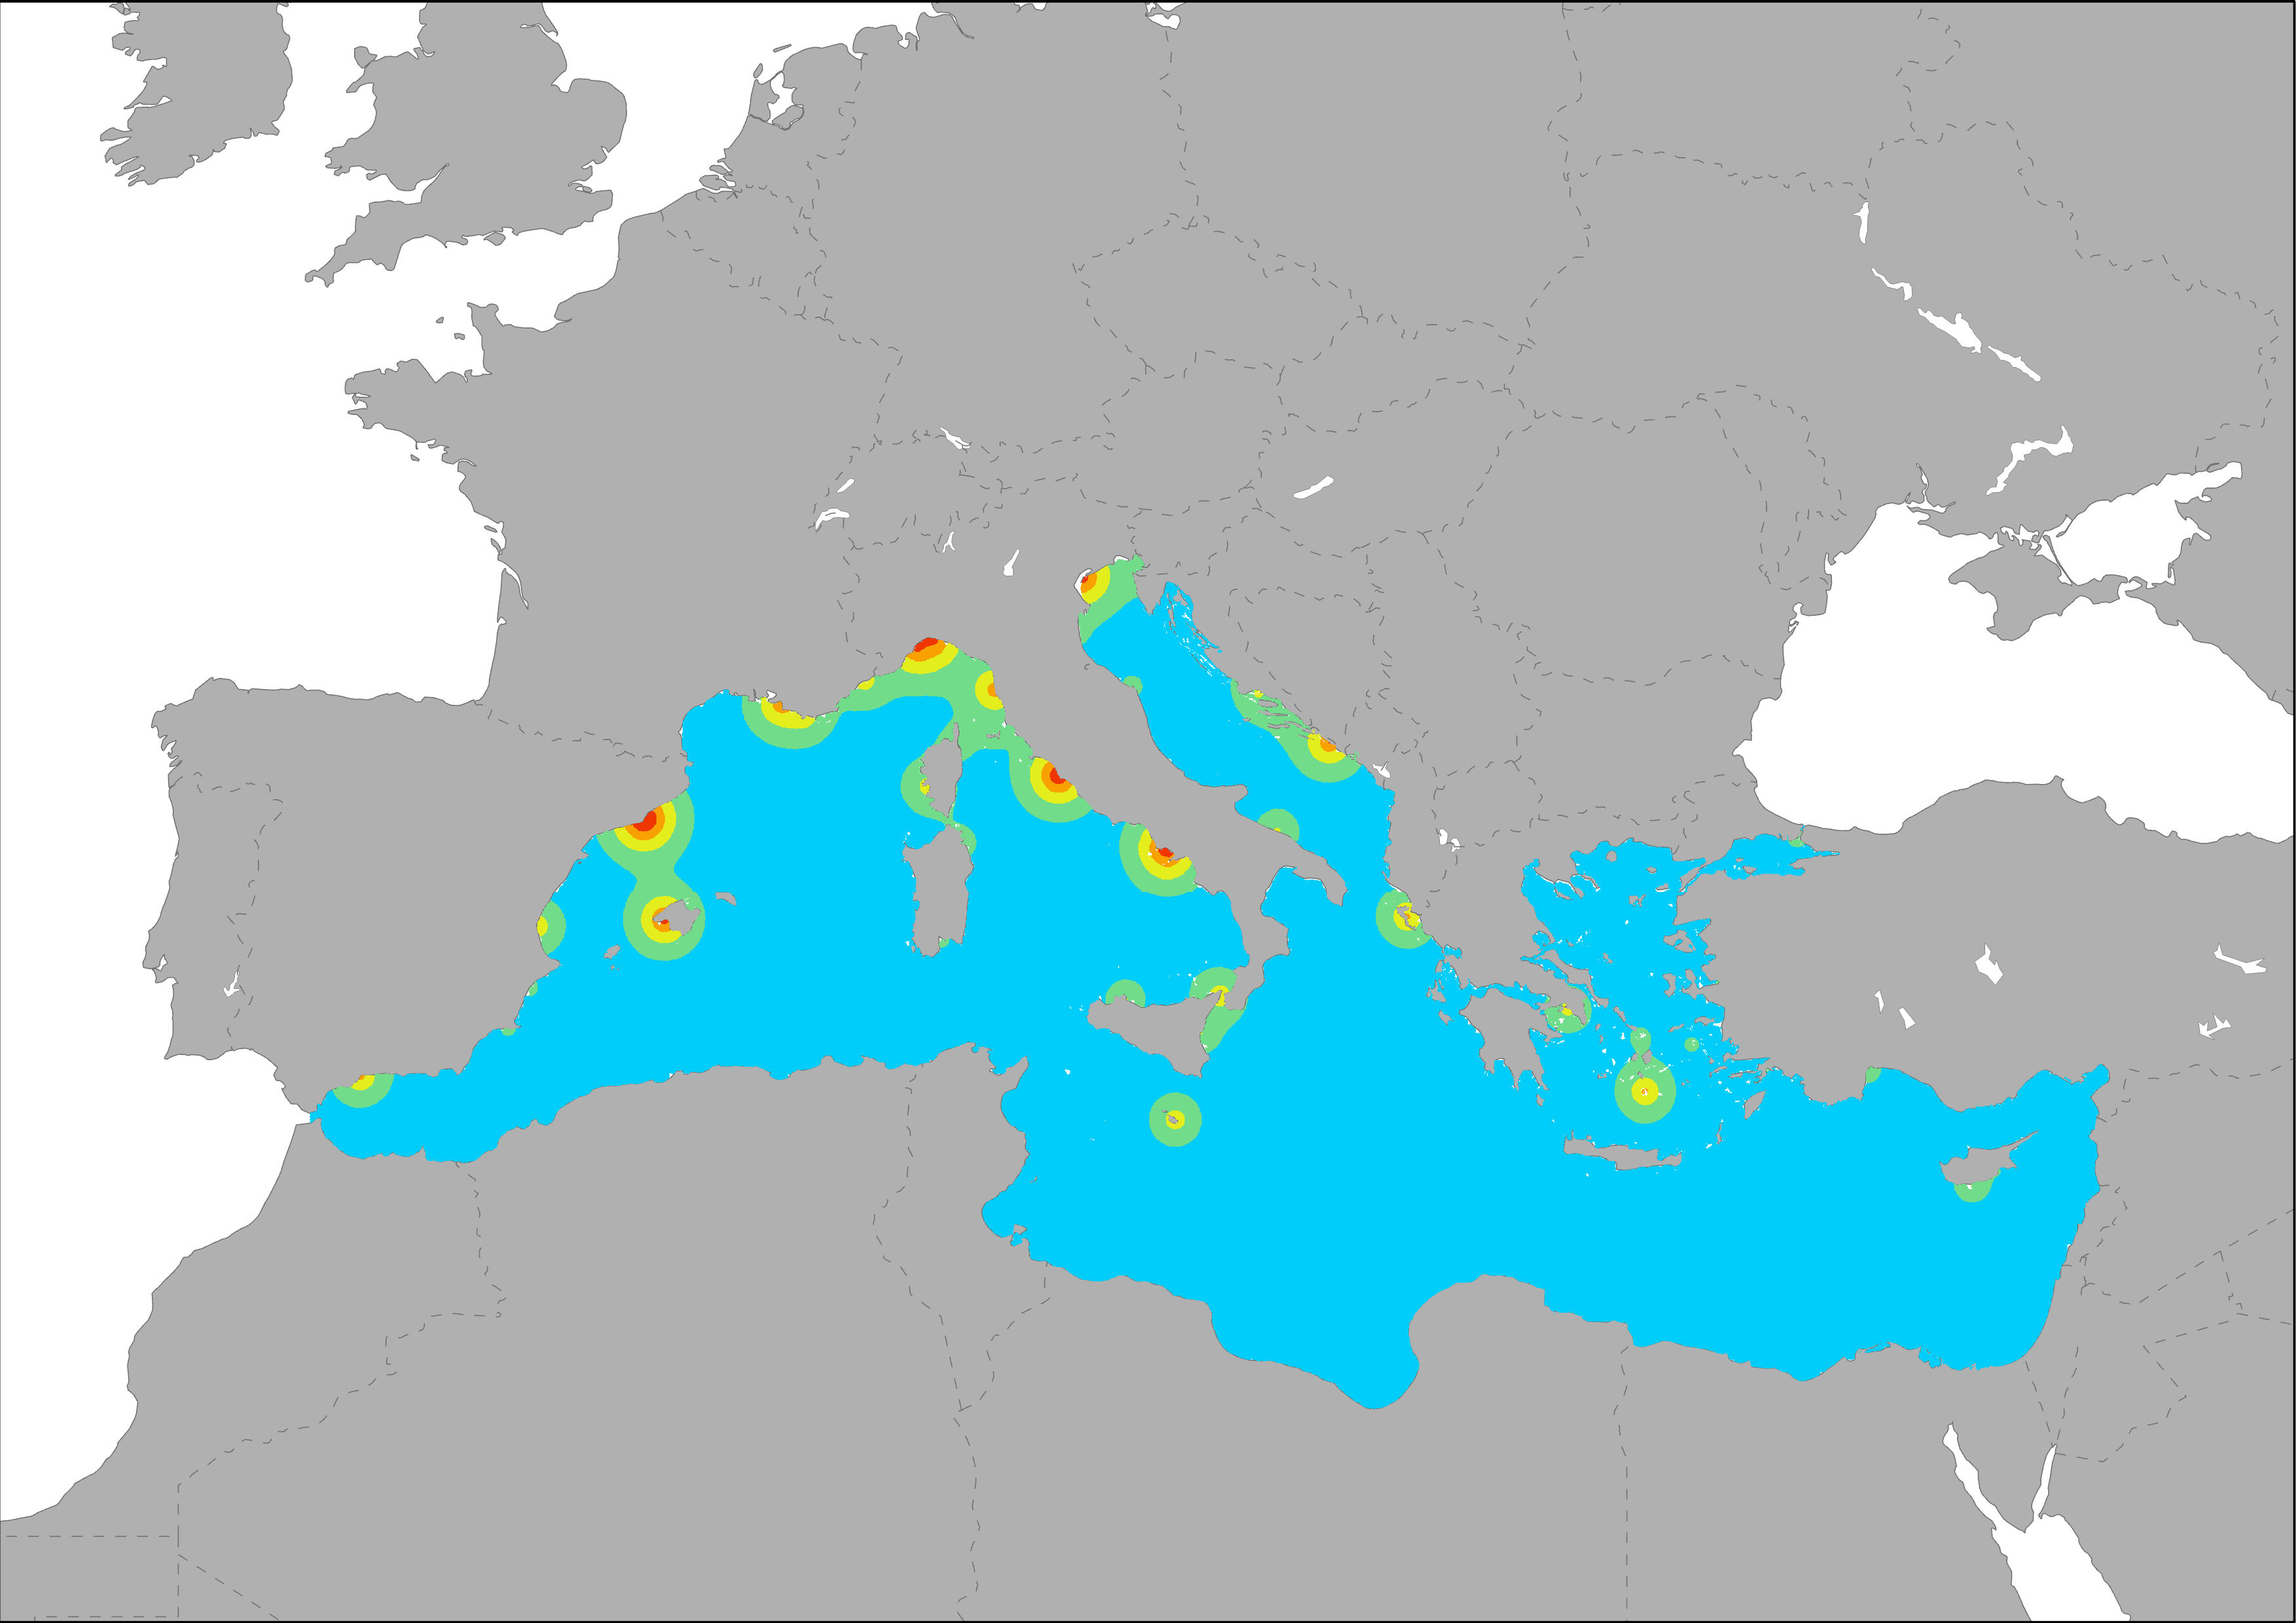
The map shows the distribution of main cruise ports in the Mediterranean Sea. Pressure on marine regions are represented by the port influence area, based also on their activity level. The dispersal of port-derived pollution was modeled as a diffusive plume based on their activity level using Eurostat data on transport of goods (thousand tonnes) and passengers (thousand passengers). Calculations were made following the same methodology developed for ESaTDOR Project (ESPON, 2013).
-
The map shows the distribution of main ferry ports in the Mediterranean Sea. Pressure on marine regions are represented by the port influence area, based also on their activity level. The dispersal of port-derived pollution was modeled as a diffusive plume based on their activity level using Eurostat data on transport of goods (thousand tonnes) and passengers (thousand passengers). Calculations were made following the same methodology developed for ESaTDOR Project (ESPON, 2013).
-
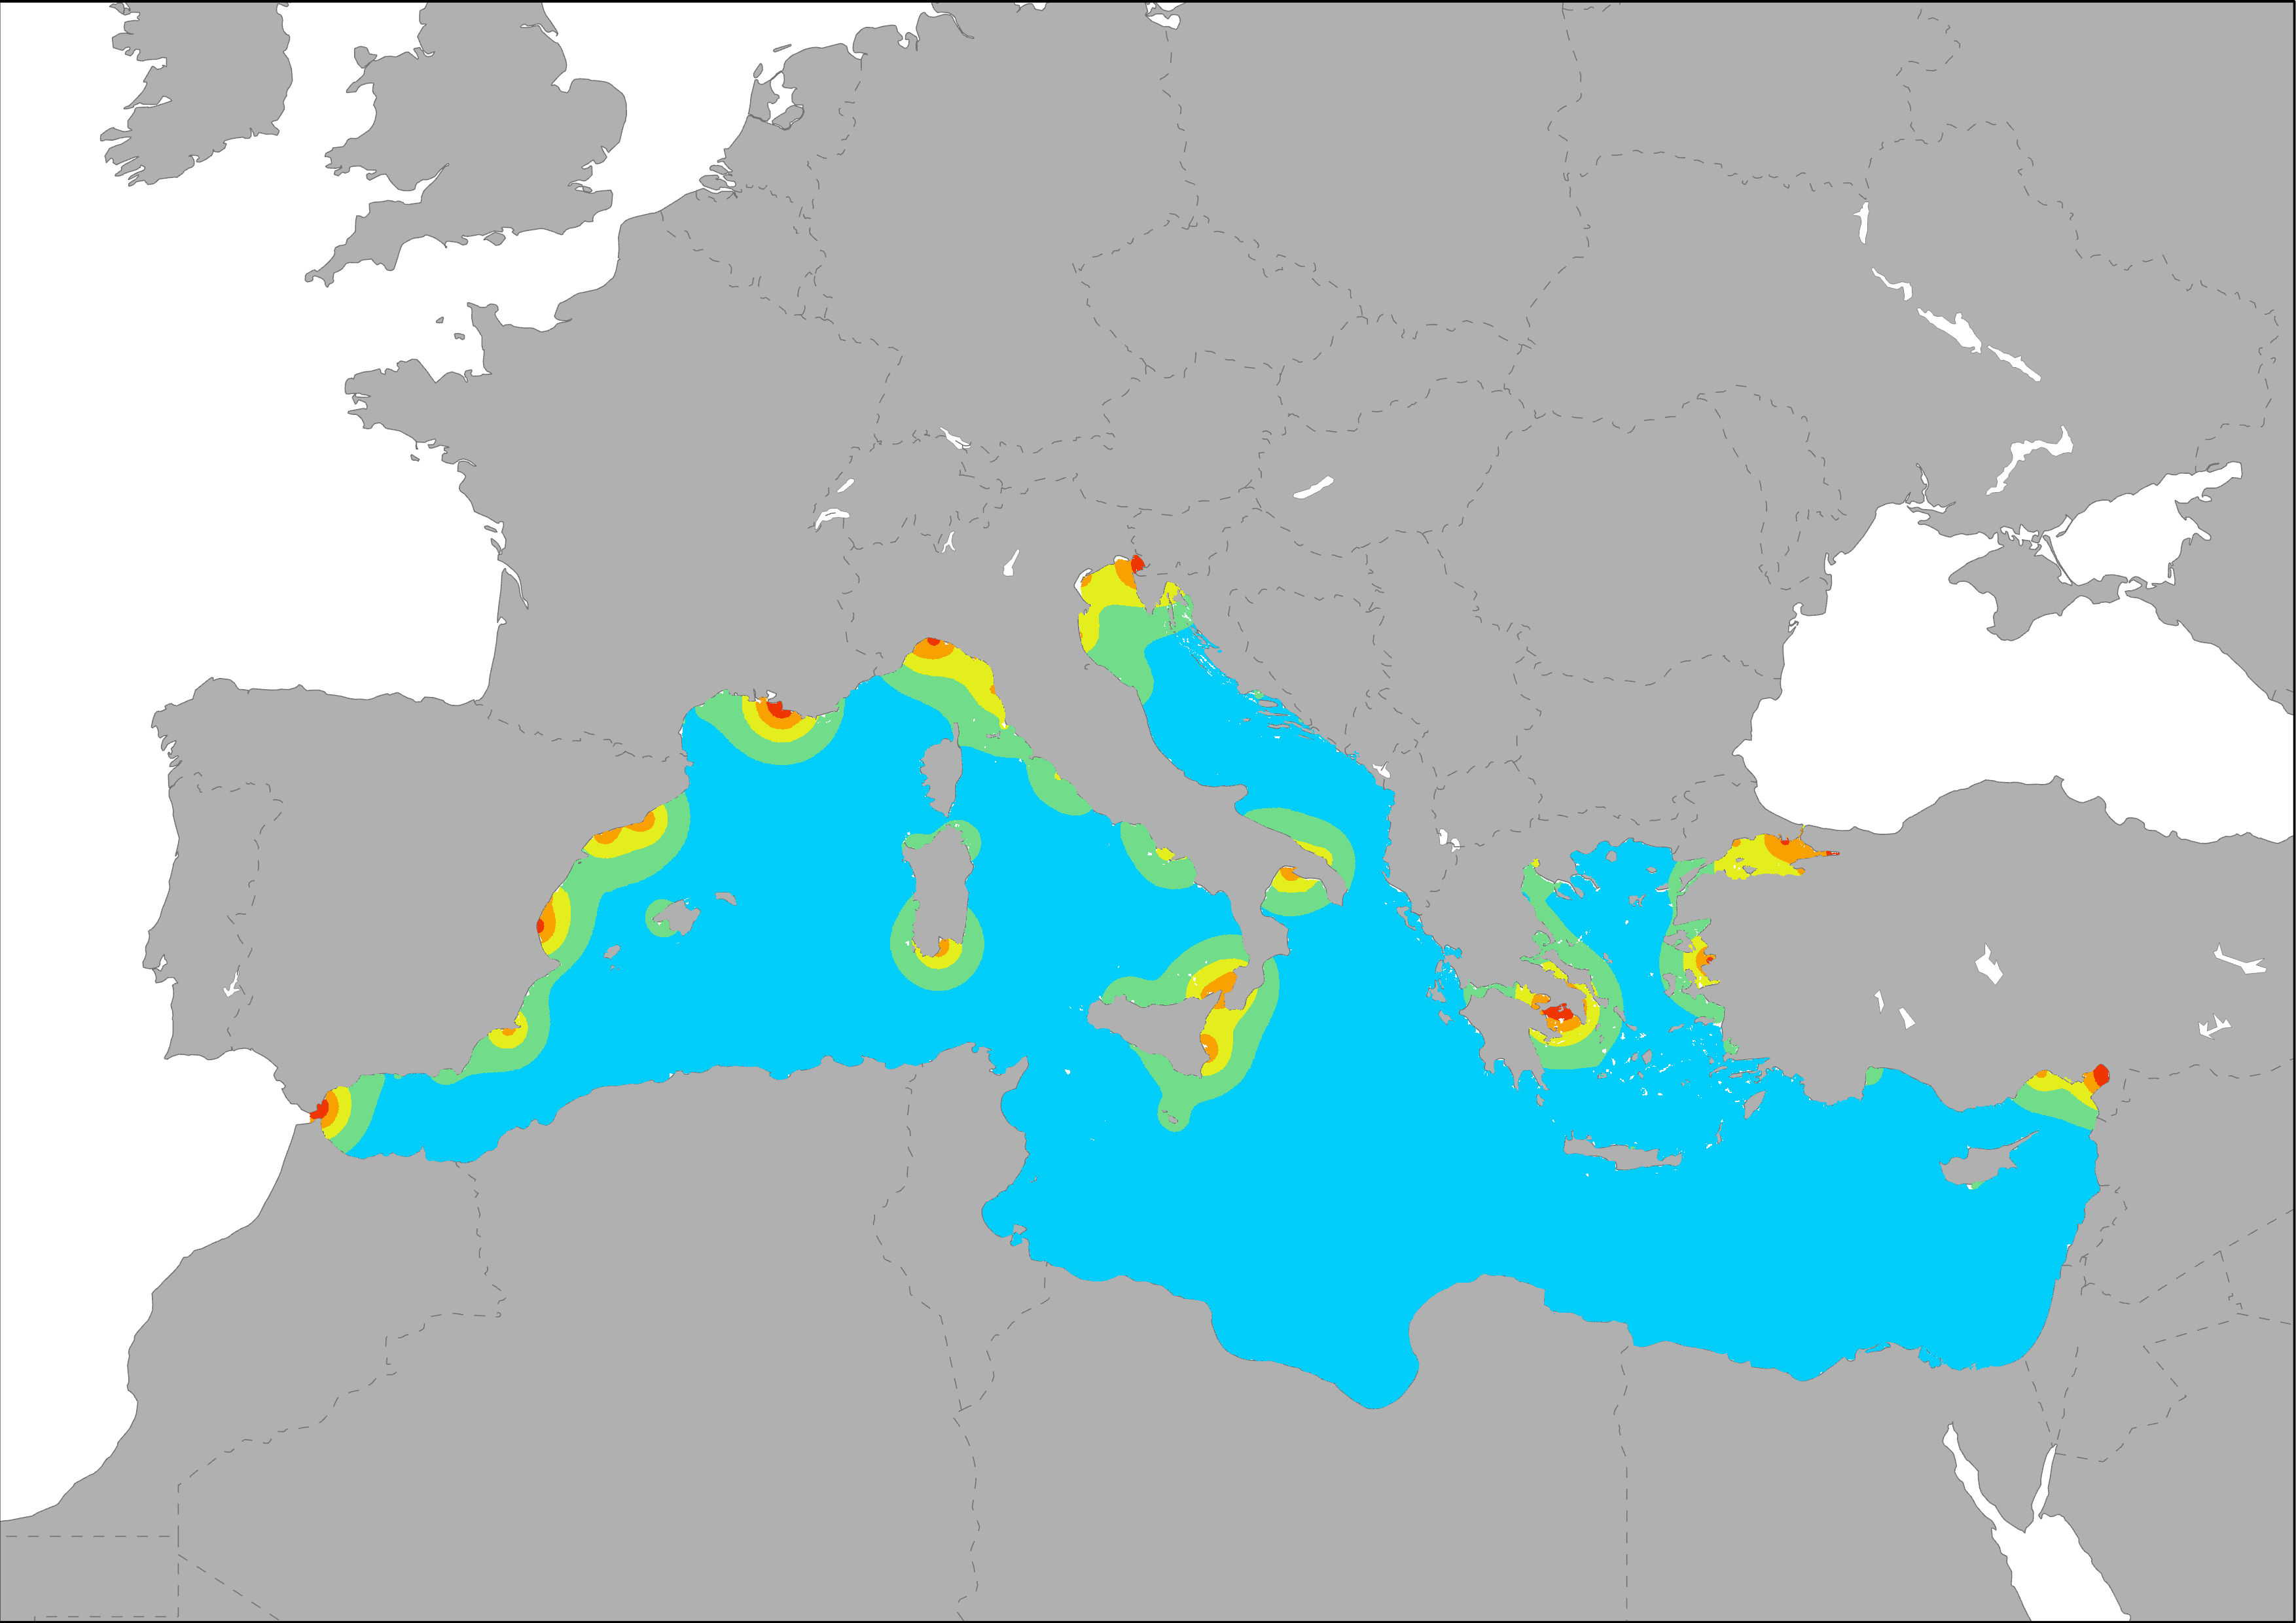
The map shows the distribution of main goods transport ports in the Mediterranean Sea. Pressure on marine regions are represented by the port influence area, based also on their activity level. The dispersal of port-derived pollution was modeled as a diffusive plume based on their activity level using Eurostat data on transport of goods (thousand tonnes) and passengers (thousand passengers). Calculations were made following the same methodology developed for ESaTDOR Project (ESPON, 2013).
-

The map shows the distribution of main passengers transport ports in the Mediterranean Sea. Pressure on marine regions are represented by the port influence area, based also on their activity level. The dispersal of port-derived pollution was modeled as a diffusive plume based on their activity level using Eurostat data on transport of goods (thousand tonnes) and passengers (thousand passengers). Calculations were made following the same methodology developed for ESaTDOR Project (ESPON, 2013).
-
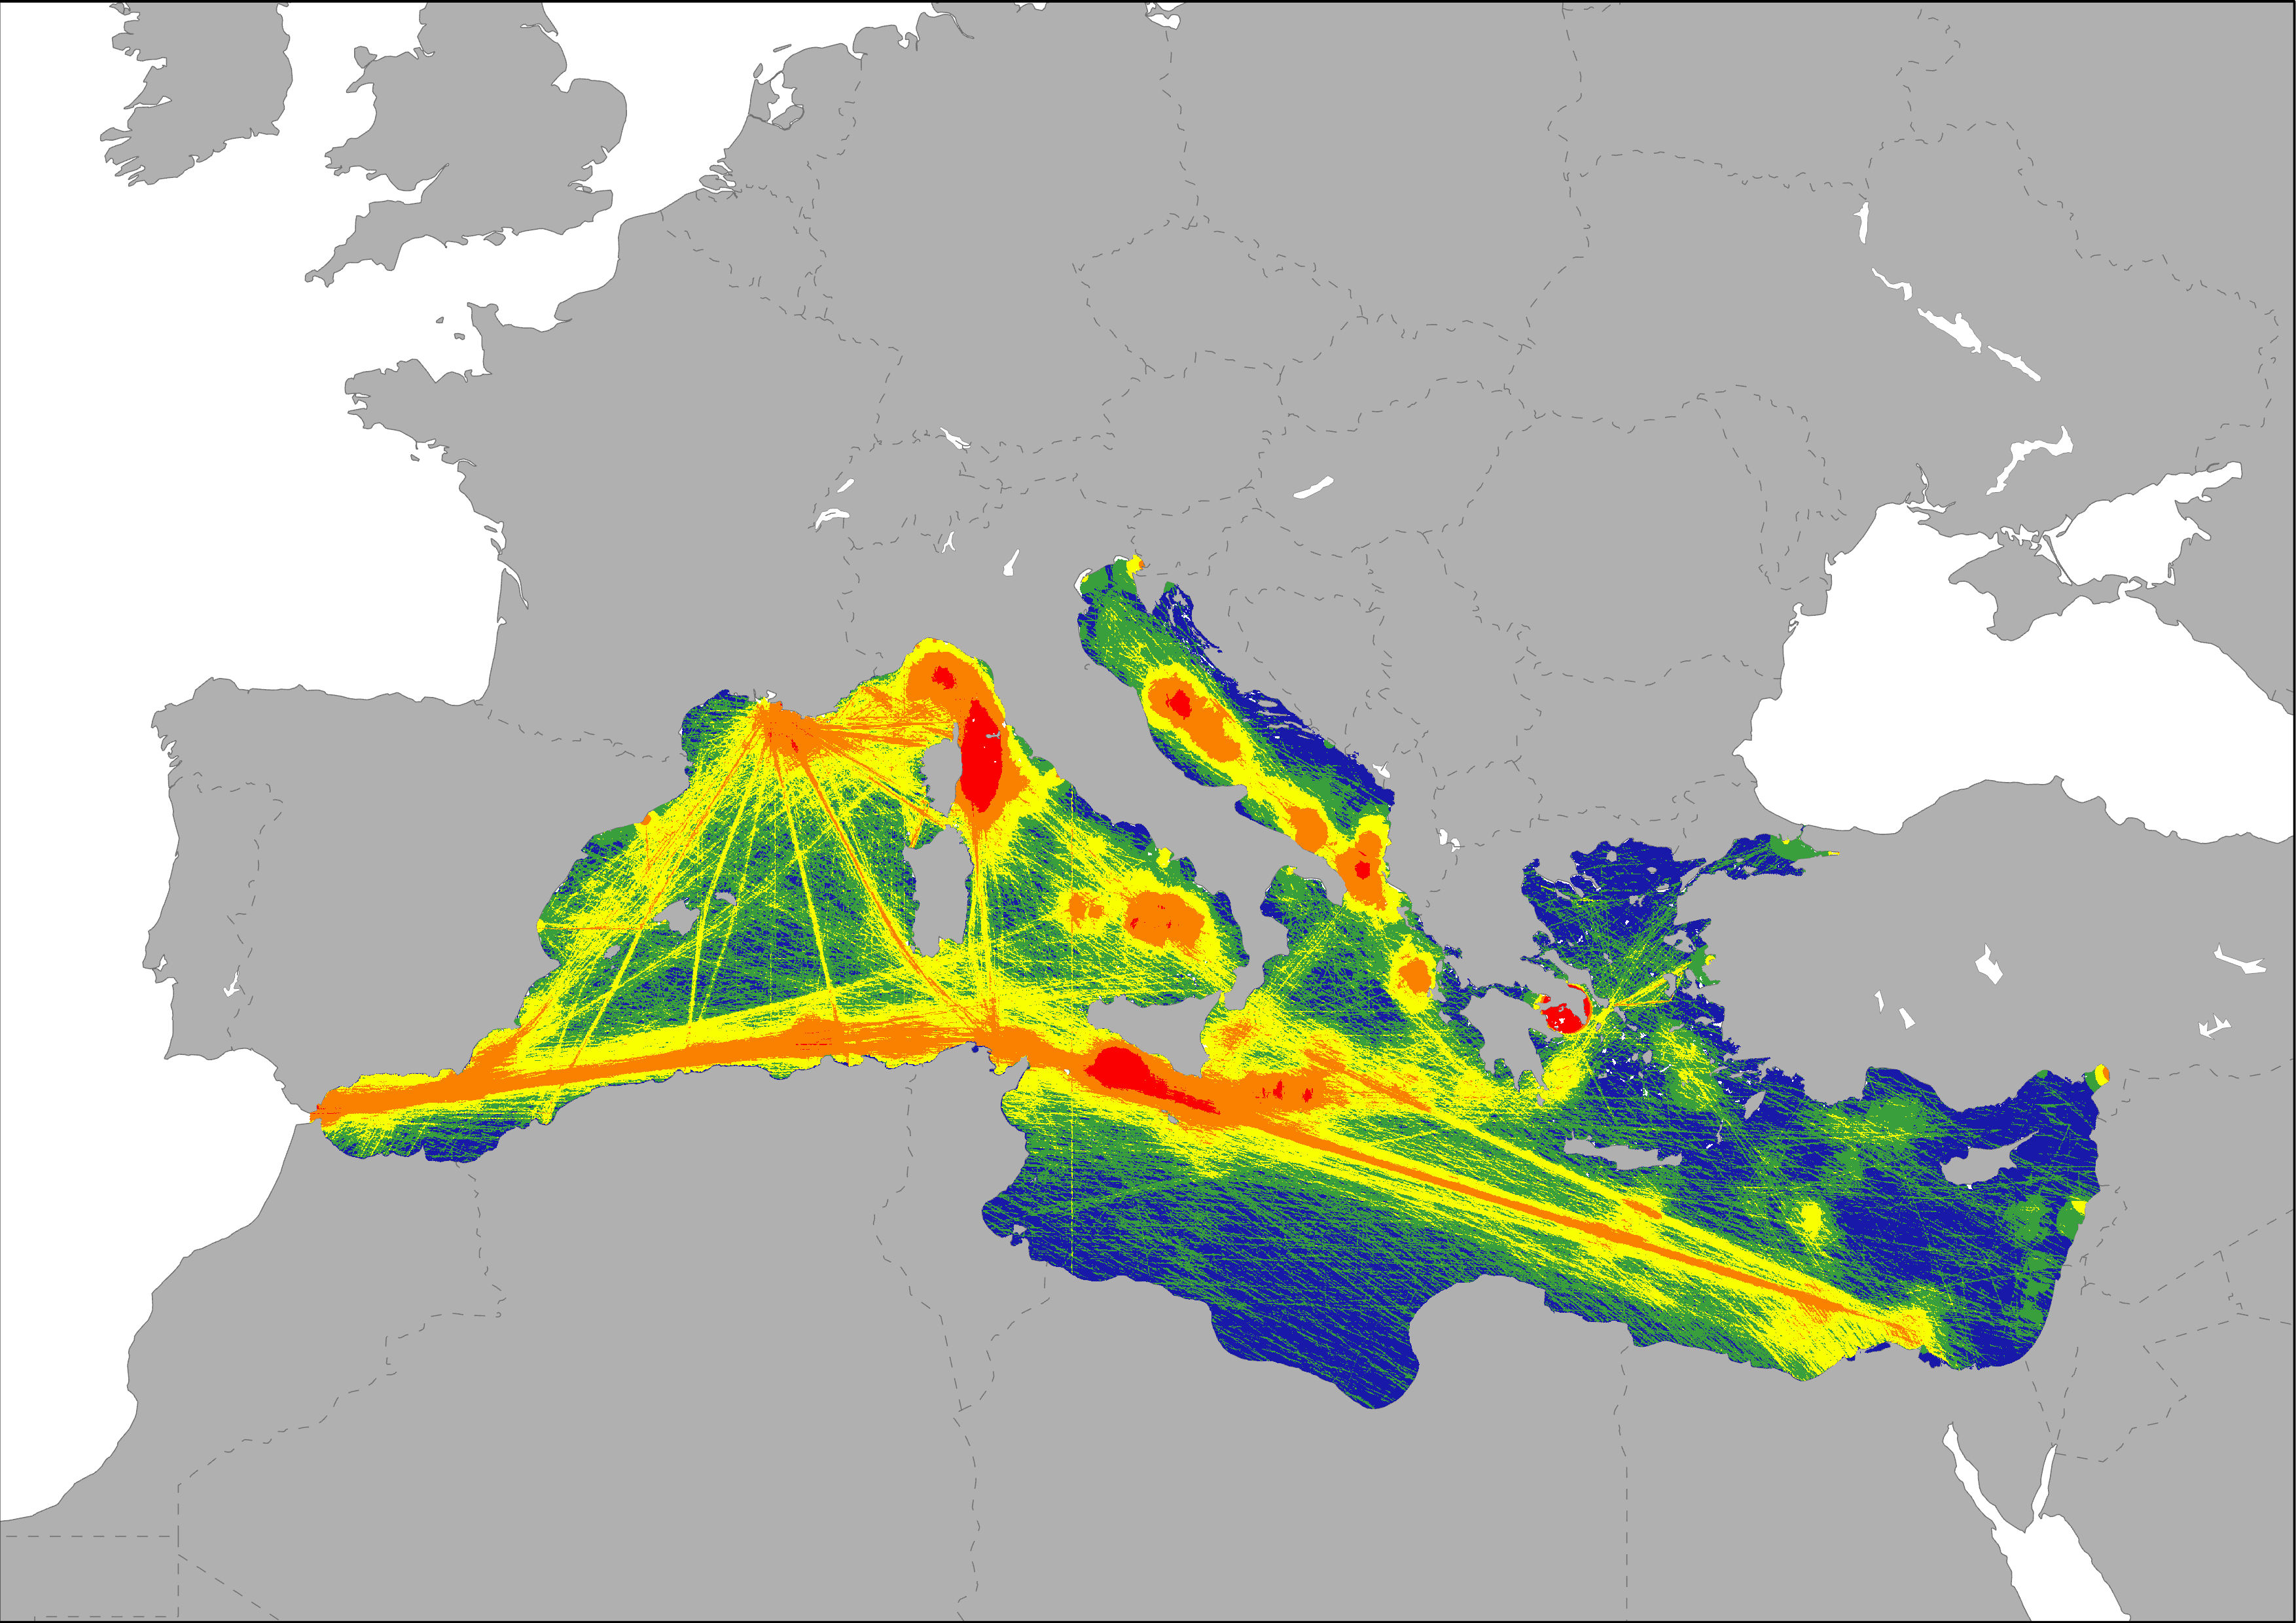
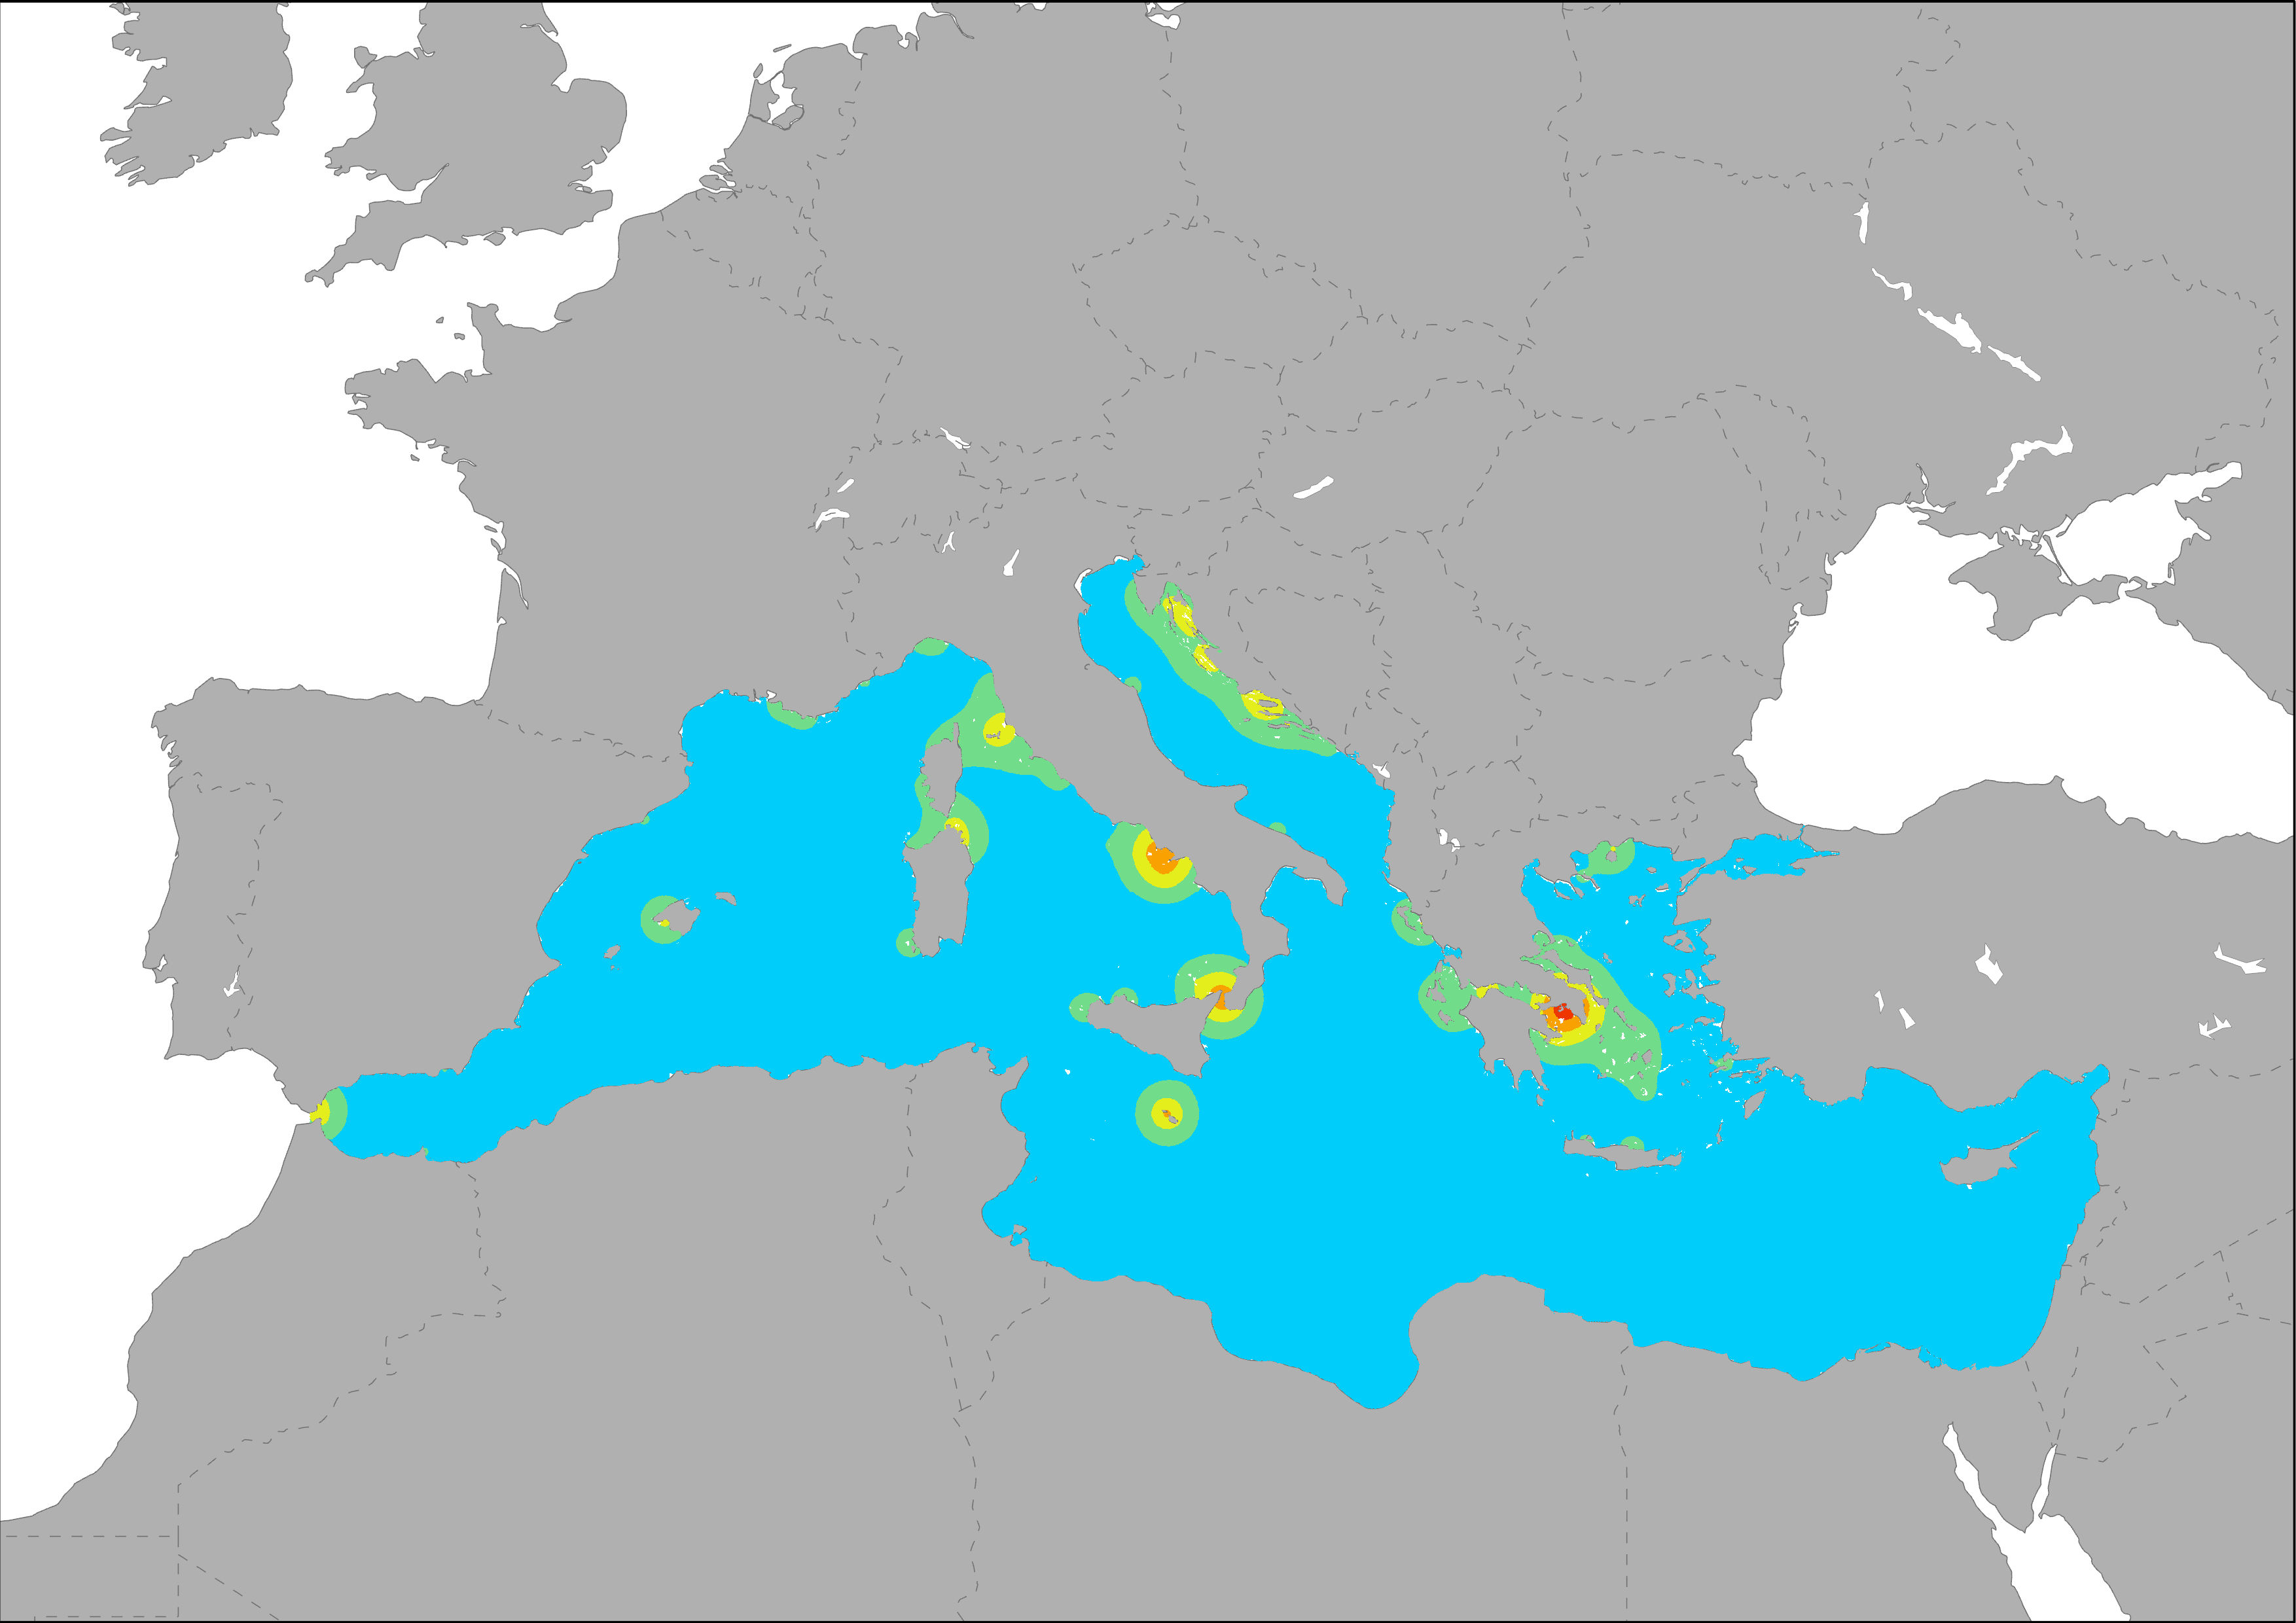
The map represents the degree of pressure based on the intensity of transport in the Mediterranean Sea. Three variables were taken into account: vessels traffic, port activity and oil spills. Shipping data (Halpern et al., 2008) provide an estimate of the occurrence of ships at a particular location, and therefore an estimate of the amount of pollution they produce, under the assumption that traveling ships primarily affect their immediate waters. The dispersal of port-derived pollution was modeled as a diffusive plume based on data of transport of goods (thousand tonnes) and passengers (thousand passengers). Pressures generated by oil spills and other pollution releases are represented as a density layer based on data registered by the REMPEC, and also the oil spills map generated by Cinirella et al, 2012 (based on JRC 2009 data).
-
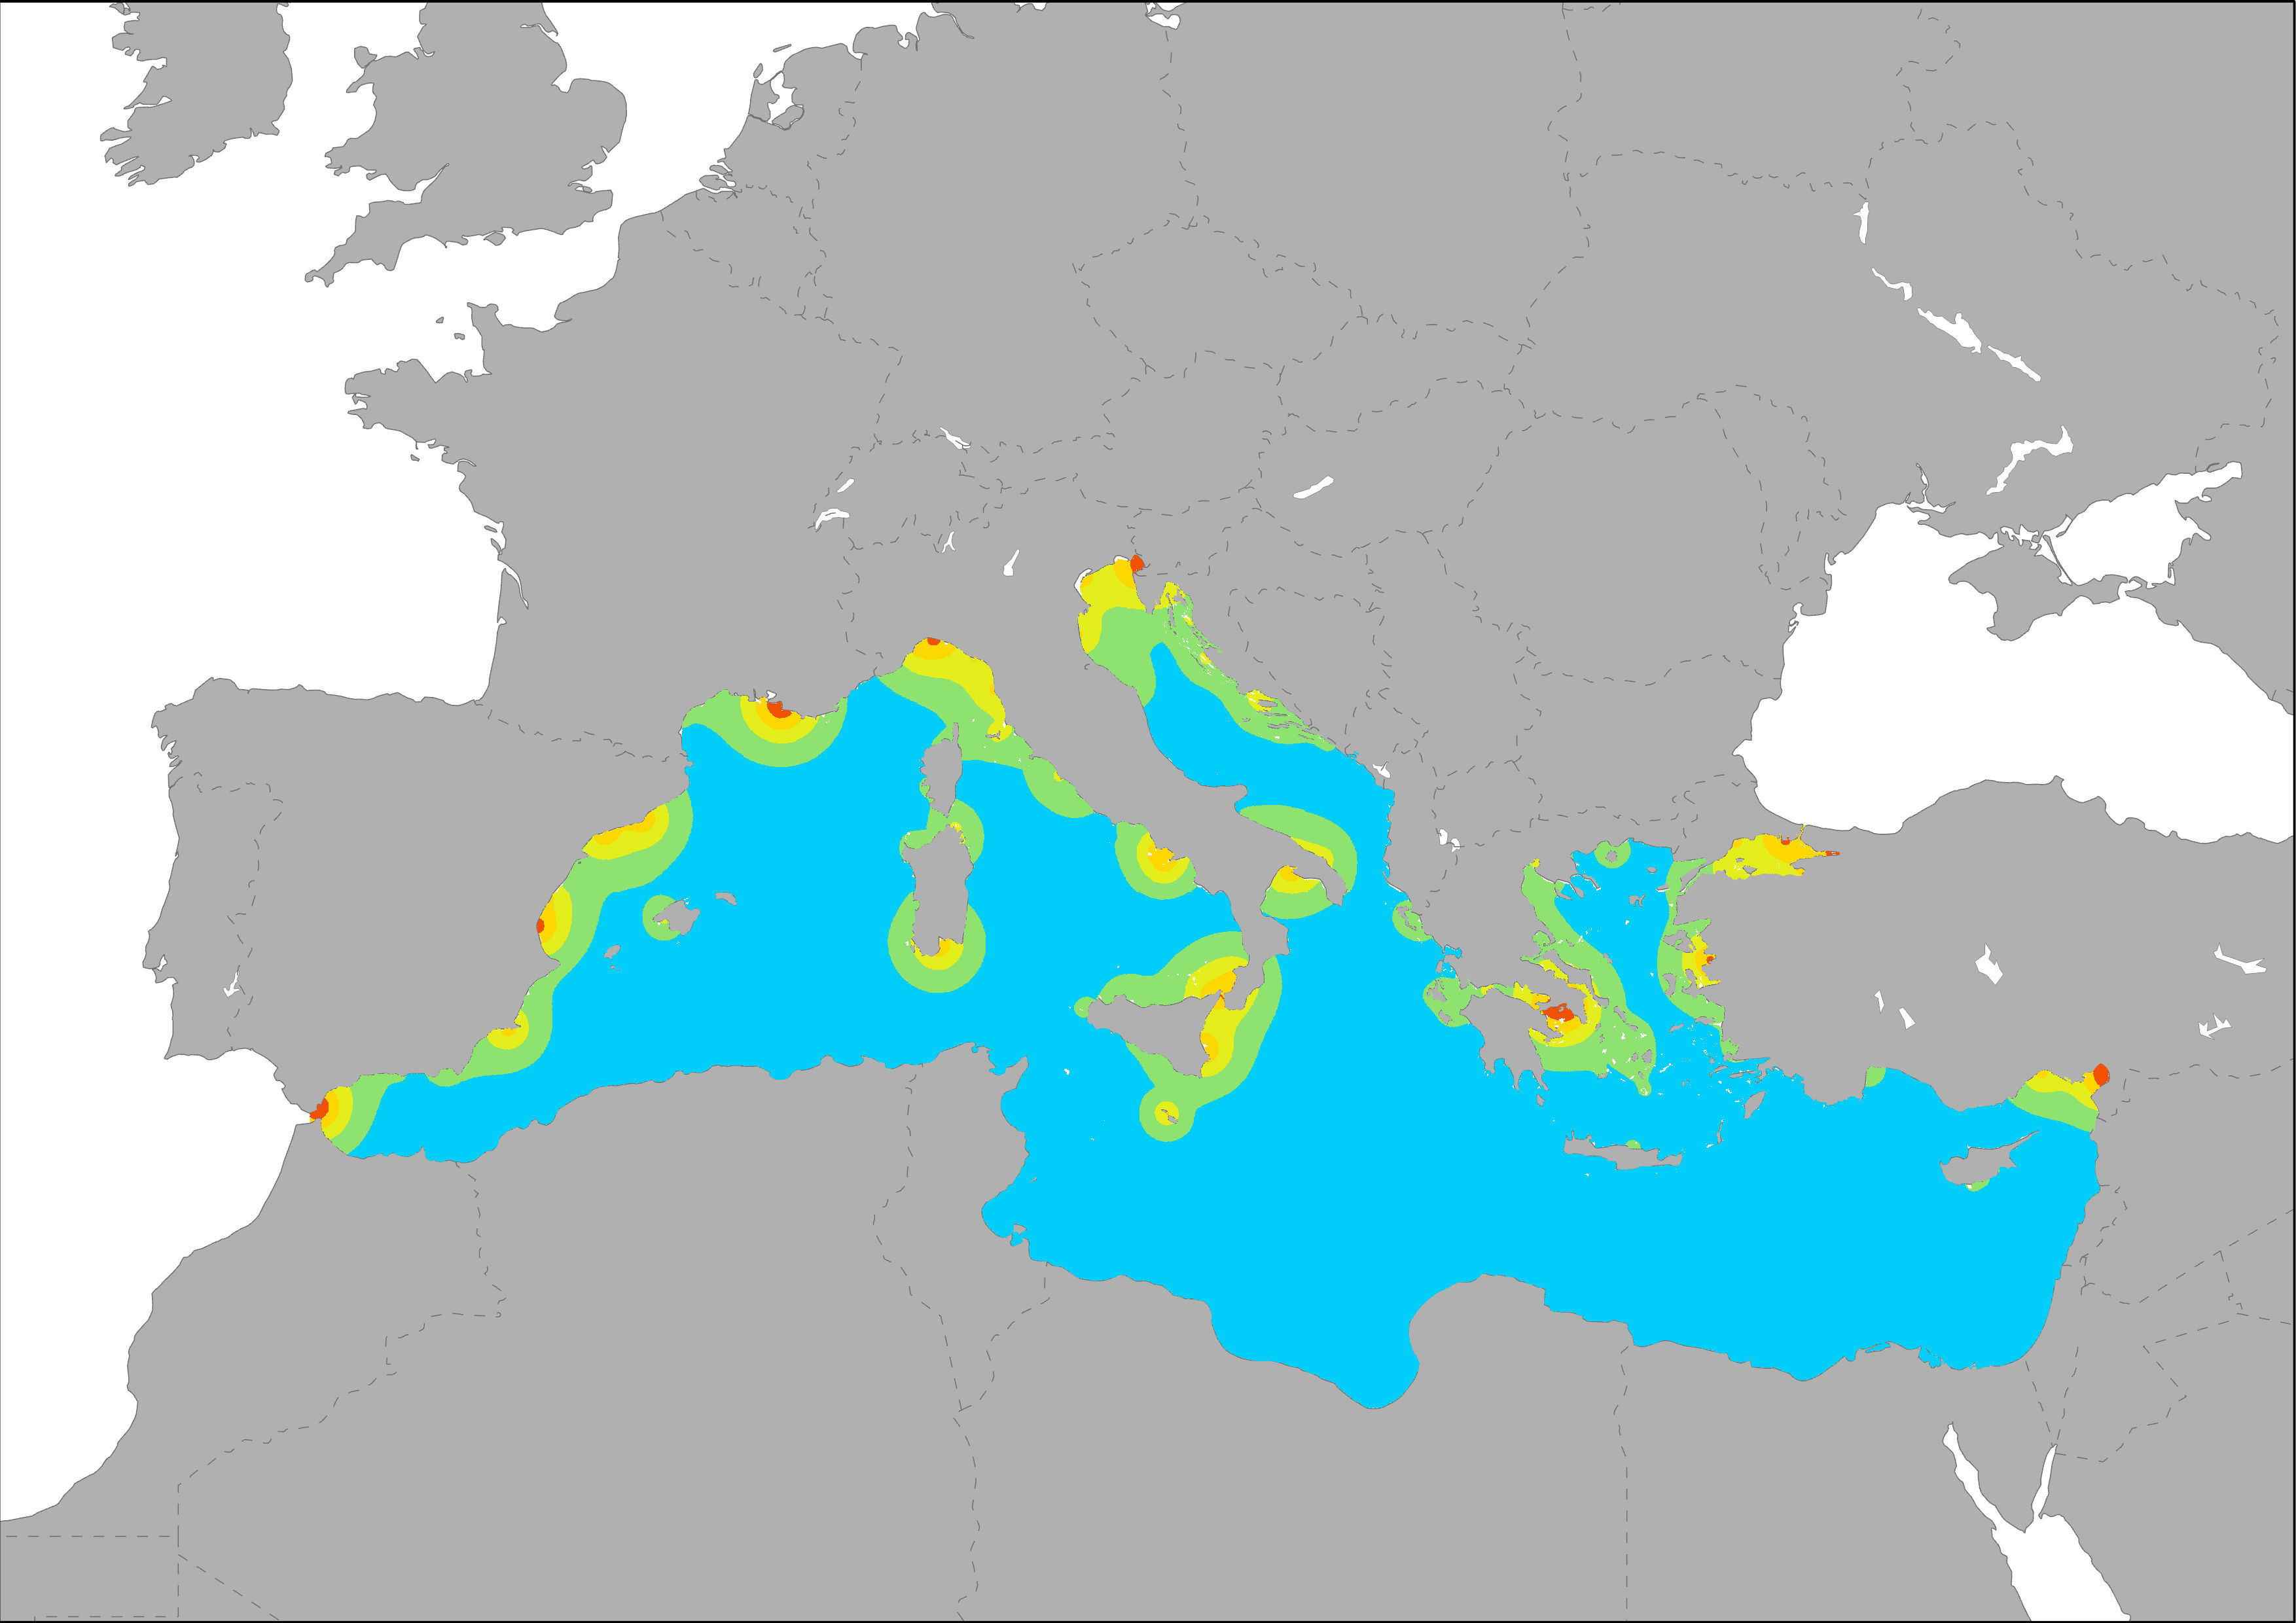
The map shows the distribution of main passenger and transport ports in the Mediterranean Sea. The dispersal of port-derived pollution was modeled as a diffusive plume based on their activity level using Eurostat data on transport of goods (thousand tonnes) and passengers (thousand passengers). Calculations were made following the same methodology developed for ESaTDOR Project (ESPON, 2013).
-
The map shows the distribution of main goods transport ports in the Mediterranean Sea. Ports are classified in groups according to its level of activity.
-
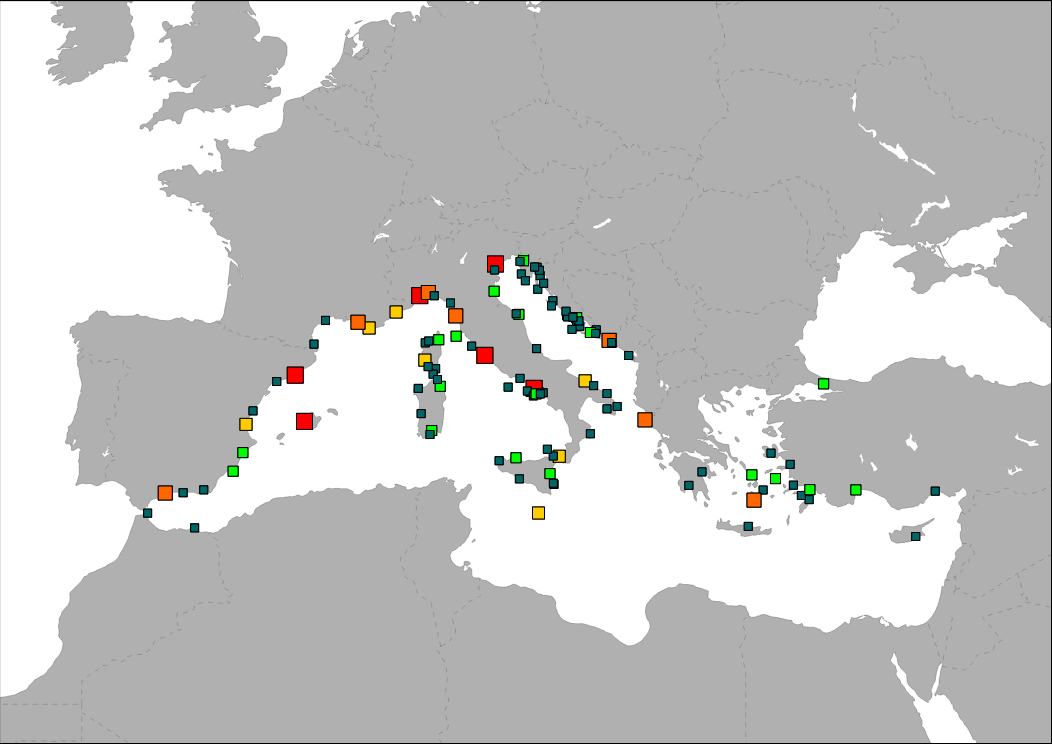
The map shows the distribution of main cruise ports in the Mediterranean Sea. Ports are classified in groups according to its level of activity.